
Similar to other data-oriented companies, here at Digital Turbine we have pretty complex data pipelines. They consist of data streams coming from Kafka, aggregation jobs by Spark, data storage systems, and data analytic tools such as Druid and Trino.
Above all, we use Apache Airflow to orchestrate all these pipelines, to make sure the jobs are synced and timed correctly, that retry in case of failure and easily show the status of each phase in the pipeline.
Since these data pipelines provide the data which our clients consume, we need them to meet our high standards. Above all expectations, we pay special attention to data completeness, data correctness and data latency.
We all expect certain things from our service providers. Take your internet provider for example:
- You expect to be online all the time! (Well, ok, a few minutes of outage per year is something I can tolerate…).
- You expect it to be as fast as the X Mbps in the plan you’re paying for! (Sure, I won’t change the internet provider company if sometimes it only reaches about 70% of it).
The set of expectations of a customer from the service he receives is called the Service Level Agreement, or in short, the SLA. Therefore, as professional engineers we do our best to meet these expectations!
In most cases, Apache Airflow helps us achieve this. We are provided with a full picture of the current status, what was successful and what has failed – enabling us to see the data completeness. We can also plan our tasks to check that their output is exactly as expected. If the result is a fail and retry, we can tackle the data correctness expectation as well.
What was missing on our side was the full picture of what should have already been finished, but hasn’t yet.
If we should have finished working on the 8:00am data by 10:00am and it didn’t happen, we want to know about it. Moreover, we want an alert for this incident and another alert when it finishes. We also want to view the history of the situation:
- How many times did it happen in the last month?
- What is the average delay?
- What times of day does it usually occur?
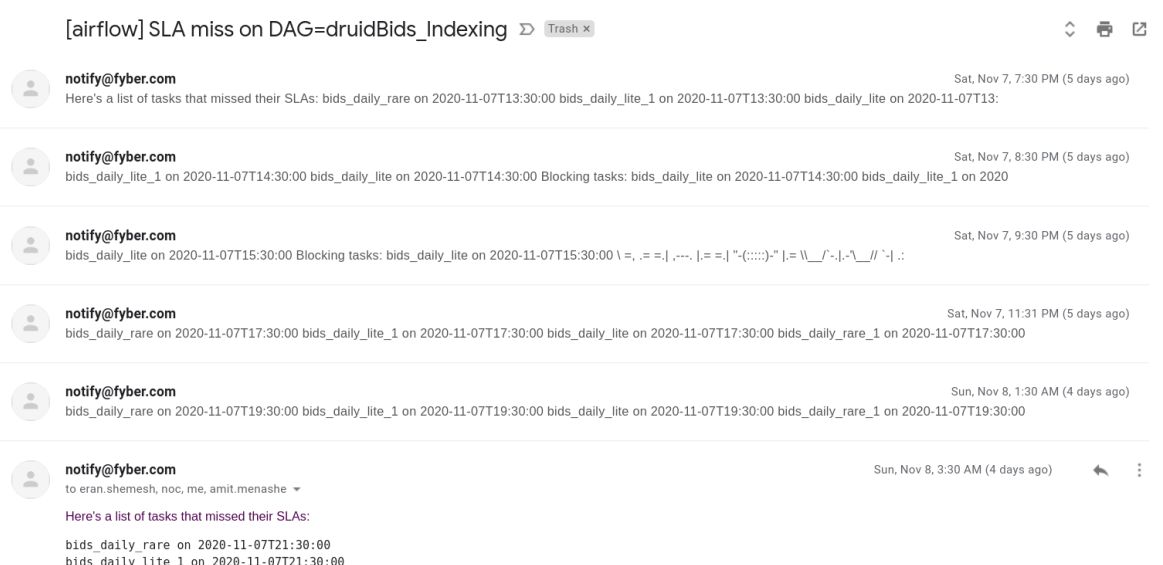
Airflow has an inherent SLA alert mechanism. When the scheduler sees such an SLA miss for some task, it sends an alert by email. The problem is, that this email is nice, but we can’t really know when each task is eventually successful. Moreover, even if there is such an email upon success following an SLA miss, it does not give us a good view of the current status at any given time. Most likely, we would have to manually trace our emails to achieve this:

We knew that we were looking for a metric, rather than just some alerts.
We normally use Prometheus to store these metrics and Grafana to display them and alert based on a predetermined rule.
Apart from sending alert emails following an SLA miss, Airflow also saves the SLA misses in its database. and we use them to create our own metrics reporting system.
SLAyer
In simple terms, SLAyer is an independent server application, looking at Airflow’s database. It reports the current status to Prometheus, by sending metrics per dag, task and execution date currently in violation of its SLA.

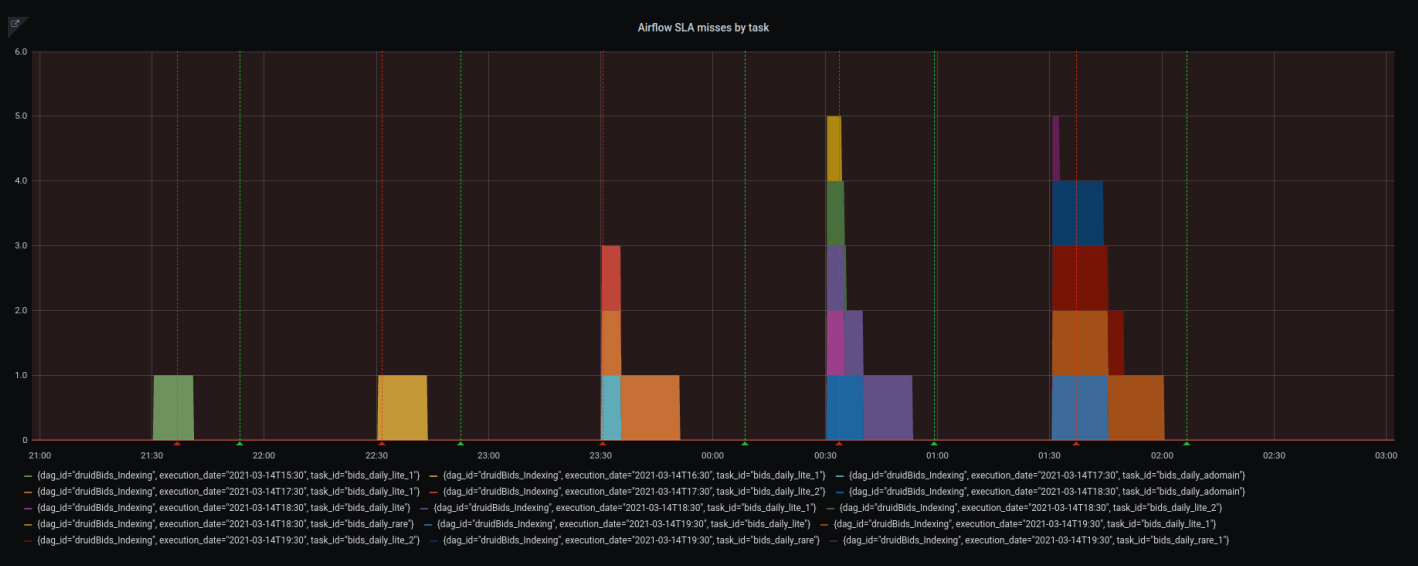
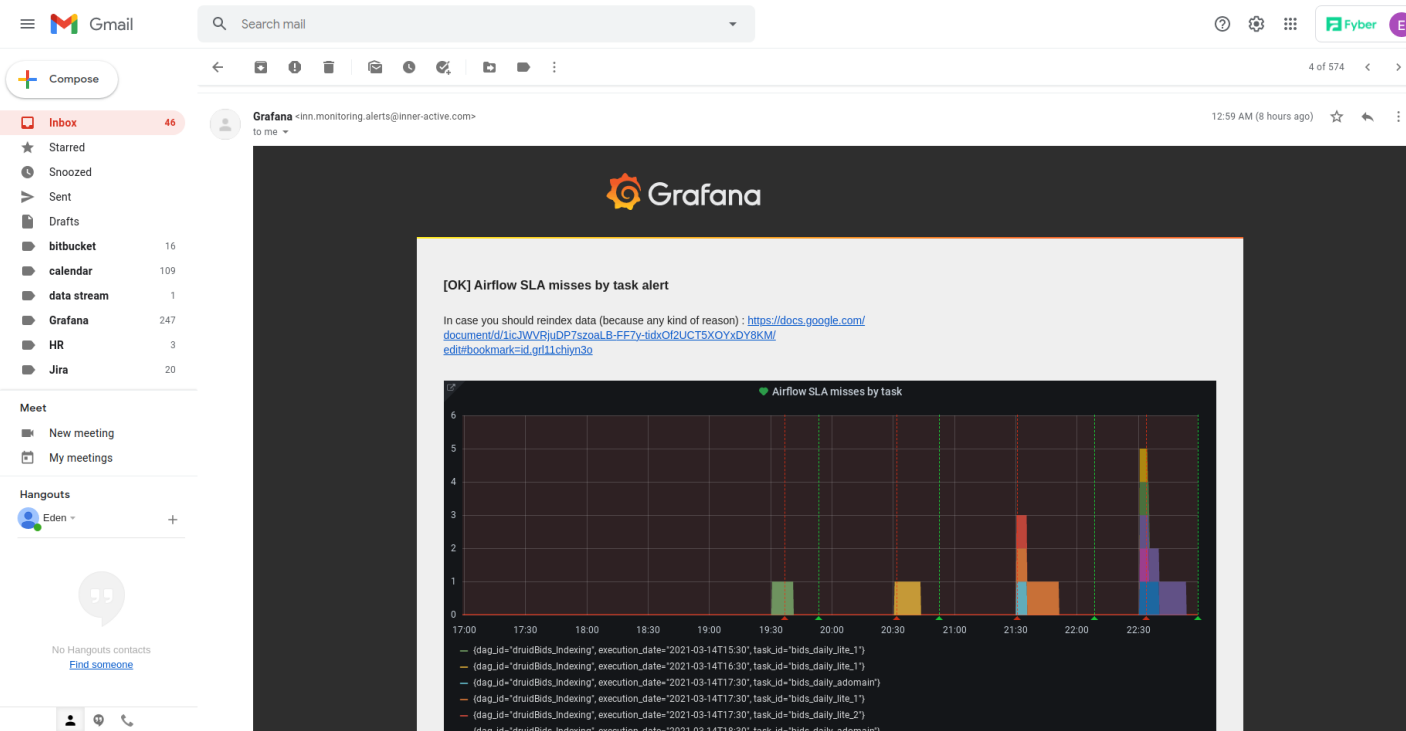
Once we know what the current status is, what the status was at 2:00am, and at what times during the day we experienced SLA misses (if any), we can receive all the relevant information via our nice and familiar Grafana board. If we want alerts as a complementary mechanism, we can easily send it from Grafana, as well as another alert when the graph has stopped displaying alerts.

Implementation
We created the SLAyer with the following steps:
- Writing a method that returns the SLA miss metric info.
- Writing the custom exporter in python for Prometheus.
- Dockerizing the exporter.
- Deploying on Kubernetes.
For the SLAyer project, we use the following requirements:
Step 1: Understanding the Status
In this step, we want to understand which tasks should have already finished and which ones haven’t yet finished.
To do this, we can look at Airflow’s database, specifically the tables sla_miss, task_instance, and dag_run.
- In the table, are the tasks that exceeded their expected time frame from the start of the DAG execution?
- In the task_instance, are all the tasks with the current state?
- In dag_run, are all the dags with the current state?
Therefore, we use the following SQL query to receive each dag, task and execution date showing in the sla_miss table, in which the task state is not valid by the task_instance table, and the dag state is not successful by the dag_run table.
Step 2: Custom Exporter in Python for Prometheus
In this step, we want to report the current status to Prometheus, by sending a metric per dag task and execution date that is currently in violation of its SLA. For that, we use prometheus_client API.
Step 3: Dockerize the Exporter
In this step, we want to build a docker image for our slayer server. For that, in the Dockerfile, we start from a python base image, add the slayer folder and install the project requirements.
Step 4: Deploy on Kubernetes
In this step, we want to deploy the slayer on Kubernetes.
To do this, follow these steps:
- Create a deployment file that runs the image from the third step
- Specify the container port to be the server port from the second step
- Set the airflow database connection value as environment variables to be used by the slayer
After that, we create a service file to expose the slayer server as a network service.
At Digital Turbine, we use Prometheus Operator to create a Prometheus Data Source for Grafana. Prometheus Operator implements the Kubernetes Operator pattern for managing a Prometheus-based Kubernetes monitoring stack, it can automatically generate monitoring target settings based on Kubernetes label queries. We carried this out using a ServiceMonitor, which declaratively specifies how groups of services should be monitored. The Operator automatically generates Prometheus scrape configuration based on the definition.
This means, if there is a new metrics endpoint matching the ServiceMonitor criteria, this target is automatically added to all the Prometheus servers selecting that ServiceMonitor.
Grafana Board
Now in the Prometheus-K8S Data Source, we can see our new slayer query. We create a new Grafana board with the following metric:
You can see the full implementation here :


.jpg)


